Macroeconomics vs. Microeconomics
- Macroeconomics: study of major components of an economy (inflation, GDP, unemployment, supply and demand)
- Microeconomics: study of how households and forms make decisions and how they interact in the markets
- Positive Economics vs. Normative Economics
-Positive: tempting to describe the world as it is (ex: minimum wage causes unemployment)
-Normative: describes the worlds and how it should be, prescriptive in nature (ex: the government should raise minimum wage)
- Wants vs. Needs
-Wants: desires of citizens, much broader than our needs
-Needs: basic requirements for survival
- Scarcity: most basic fundamental economic problem that all societies face
- facing unlimited wants with limited resources
- Shortage: a situation in which quantity demand is greater than quantity supplied
- Good vs. Wants
-Goods: tangible commodities (bought, sold, traded, and produced), consumer and capital goods that are intended for final use by the consumer
-Wants: items used in the creation of other goods such as factory machinery and trucks
- Services: work that is performed for someone else
- Factors of Production (FOP)
- Land (natural resources)
- Labor
- Capital- human/physical (tools, machinery, buildings)
- Entrepreneurship
-Human capital: human made objects used to create other goods and services
-Physical capital: human made objects used to create other goods and services
- Opportunity Cost: most desirable alternative given up by making a decision
- Production Possibilities Graph (PPG), Production Possibilities Curve (PPC), Production Possibilities Frontier (PPF)
-Production Possibilities Graph: shows alternative ways to use resources
-Productive Efficiency: producing at the lowest cost, allocating resources efficiently and have full employment of resources; at any point on the curve
-Allocative Efficiency: combination of most desired by society; where to produce on the curve
- Example of Graph:

Point D: Attainable, but inefficient
Point B and A: Attainable, but efficient
Point C: Unattainable
- Law of Increasing Opportunity Cost
-When resources are shifted from making one good or service to another, the cost of producing the second item increases
-This occurs because not all resources are equally suited for the production of all goods and services
- 4 Key Assumptions of Production Possibilities
- Only two goods can be produced
- Full employment of resources
- There are fixed resources
- Fixed technology
- Demand and Supply
-Demand is the quantities that people are willing and able to buy at various prices
-The Law of Demand: there is and inverse relationship between quantity demanded
-Change in quantity demanded is caused by change in price
-Causes of "change in demand":
- Change in buyers taste (advertising)
- Change in number of buyers
- Change in income ((normal goods, inferior goods)
- Change in the price of related goods (substitute goods complimentary goods)
- Change in expectations
-Supply is the quantities that producers or sellers are willing and able to produce/sell at various prices
-The Law of Supply: there is a direct relationship between the price and quantity supplied
-Change in quantity supplied is caused by a change in price
-Causes of "change in supply":
- Change in anything except price, such as factor price
- Change in resource
- Change in technology or technique
- Change in taxes or subsidies
- Change in prices of other goods
- Change in expectations
- Change in the number of supplies
- Elasticity of Demand
-Elastic Demand: a product is elastic when demand will change greatly given a small change in price (greater than 1)
- Many substitutes
- Luxury goods
-Inelastic Demand: a product is said o be inelastic if the demand for it will not change or it changes very little regardless of price (less than 1)
- Few substitutes
- Necessary
- Calculating Elasticity Demand

- Video of Elasticity Demand In Steps
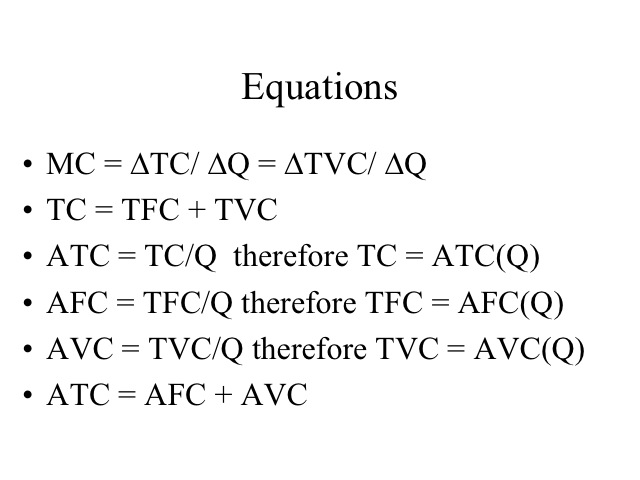
- Total Revenue
(Price)(Quantity)= Total Revenue
- Other Equations
- Price Floor and Price Ceiling
-Price Floor: minimum price for good or service
-Price Ceiling: maximum price that may be exchanged for good or service
- Expansion
-Real output in the economy is increasing, and the unemployment rate is deadening
-The peak is the real output at its highest point
- Recession
-Real output is decreasing, and the unemployment rate is rising
- Trough
-Lowest point of real GDP
Everything is labeled and organized and helps with studying! The equations to calculate production costs like total revenue, marginal revenue, etc. is helpful in making sure I can remember them. Good stuff.
ReplyDeleteI also enjoy how everything is thoroughly explained and organized. However, I think a video recap over some topics such as Supply and Demand would be helpful as well!
ReplyDeleteI was still unsure about what price floor and price ceiling was, but your graph really explained and cleared things up.
ReplyDeleteThe information for this chapter was very well organized with pictures for most parts of the notes. Also the video was a good aspect as it showed another way of presenting the notes. All in all this is very helpful for notes.
ReplyDeleteThe whole unit was summarized well into one post. You should post a video summarizing the price floor / price ceiling, I find that topic confusing.
ReplyDeleteAll of your pictures and graphs really helped me understand much more.
ReplyDeleteGreat job! I like how you have specifically separated all the graphs and equations separately in order to make the most important things stand out. Notes are well stated and all the charts are very well examples.
ReplyDelete